
E-3 visa guide
What 2026-Q2 LCA data says about the E-3 market
Public DOL LCA data shows where E-3 sponsorship demand is concentrated, which roles command high wages, and what employers should plan around.
By Kelvin Tran · 9 min read · Published Sep 29, 2026
Reviewed by Kelvin Tran, Admitted in New York and Victoria, Australia
The market read
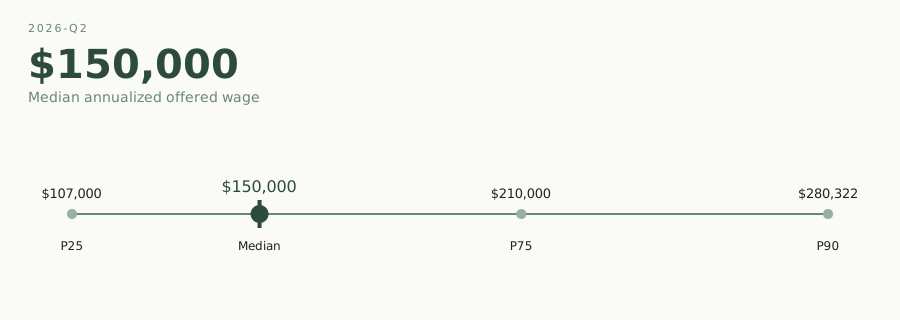
The E-3 market remains concentrated, high-wage, and more varied by role than the usual tech-only narrative suggests. In 2026-Q2, employers filed 2,406 E-3 LCAs, with 93.02% certified at the LCA stage and a $150,000 median annualized offered wage. That is the broad shape of the quarter: steady outcome rates, a wage profile that sits well above ordinary professional hiring, and a filing mix that still clusters around a few states and a few large employers.
One caution before reading too much into the headline certification rate: LCA filings are not visa issuances. A certified LCA is one step in the process, not the visa itself. And when an employer withdraws a filing, withdrawn does not mean denied. Those distinctions matter, especially for teams that use public LCA data as a planning input rather than a scorecard.
The public record also needs one housekeeping note. Employer names were deduped before aggregation, so the employer counts below are useful for market reading, not a perfect census of every spelling variant. The analysis is based on public-disclosure data and includes no worker-level PII. The underlying dataset is available here.
What changed vs prior analyses
Compared with 2026-Q1, the quarter moved back up in volume after a softer start to the year. Filings rose from 2,074 to 2,406, a 16.01% increase quarter over quarter. That is a meaningful rebound, though not a clean straight line: the prior four-quarter window shows the category moving between roughly 2,100 and 2,500 filings, which is consistent with a market that is active but not explosive.
The outcome mix stayed remarkably stable. Certified filings edged down by 0.13 percentage points from Q1, to 93.02%. Denials were 3.49%, and withdrawals were 2.49%. The main editorial point here is simple: the public LCA layer is not showing a dramatic break in outcomes. Planning should therefore focus less on fear of a sudden approval collapse and more on whether filings are cleanly built in the first place.
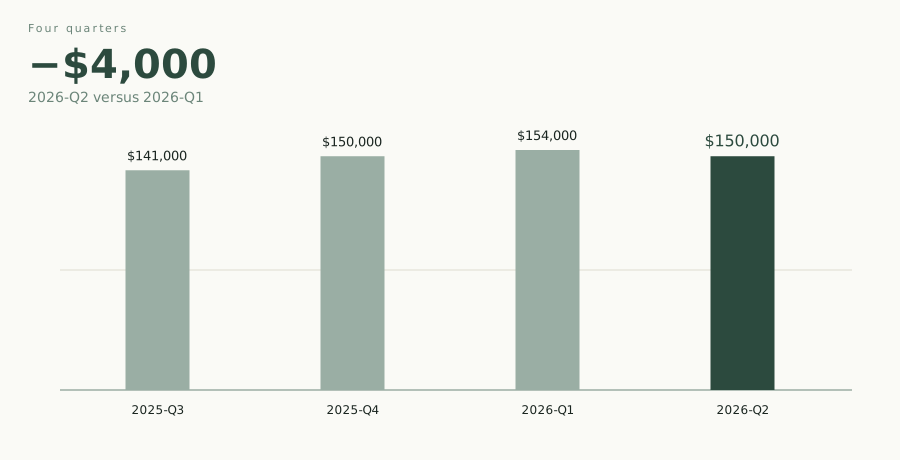
Median wages also cooled a bit after rising in Q1. The median annualized offered wage fell from $154,000 to $150,000, a 2.6% decline. That does not read like a structural reset; it reads like normal quarter-to-quarter movement inside a high-wage category. The broader four-quarter trend still points upward from $141,000 in 2025-Q3 to $150,000 in 2026-Q2. The wage trend chart shows that the line moved, but not in a way that suggests the category has become cheaper or less senior overall.
There is a reasonable contextual backdrop for that wage movement. A cited reason candidate points to broader wage-cost conditions as a directional association, not a cause. That is the right level of caution here: public labor data can help frame the quarter, but it does not explain individual LCA decisions.
What changed
The biggest change in the quarter was volume, not structure. The filing mix still looks like a mature sponsorship market: concentrated, high-wage, and anchored by repeat employers. The top listed employers represented only 7.60% of filings, which is a useful reminder that the recognizable names do not own the market. There is a long tail of sponsors using the E-3 category for specialist talent.
That long tail matters because it changes how employers should think about process discipline. Large repeat filers can rely on internal muscle memory. Smaller employers cannot. They need the role description, wage level, and specialty-occupation rationale to be more deliberate, because they do not benefit from the same public pattern recognition. The employer-share shift chart shows some of the familiar names moving around quarter to quarter, but the bigger story is that the category remains open to companies without massive immigration operations.
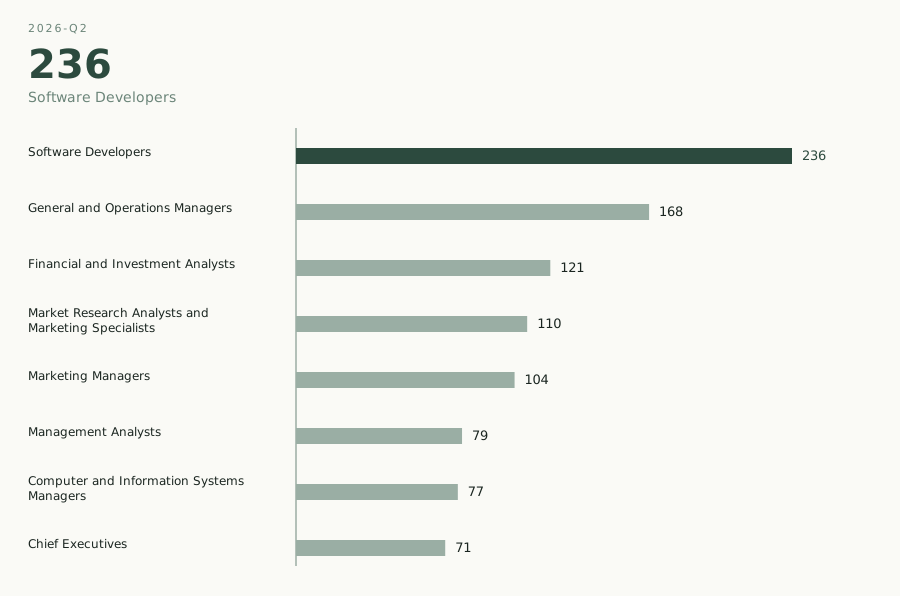
The occupational mix also stayed broader than a software-only reading would suggest. Software Developers remained the largest single SOC at 9.81% of filings, but the surrounding field was dense with business-facing roles: General and Operations Managers, Financial and Investment Analysts, Market Research Analysts and Marketing Specialists, Marketing Managers, Management Analysts, Computer and Information Systems Managers, Lawyers, and Chief Executives. Taken together, those business-facing SOCs accounted for 32.54% of filings in the selected analysis.
That is the part employers should not miss. The E-3 is often discussed as if it belongs mainly to engineering teams. The data says otherwise. It is a professional mobility tool for a wider set of functions, provided the record supports the specialty occupation. For non-technical employers, that means the filing has to be built around the actual work, not around a generic title.
Roles and wages
The wage distribution is one of the clearest signs that this is a serious professional market, not a narrow visa lane for one type of hire. The 90th-percentile wage sat at $280,322, which is $130,322 above the median. That spread is wide enough to matter on its own. It shows the category being used for both routine professional roles and very senior positions.
The upper tail is especially visible in the SOC data. Chief Executives carried a median annualized wage of $300,000, Lawyers $280,000, and Computer and Information Systems Managers $240,000. Those are not edge cases. They are part of the public filing mix. The wage-percentiles chart makes the same point visually: the distribution is broad, and the top end is elevated.
A few job titles reinforce that breadth. Software Engineer was the most common title in the public file, but Chief Executive Officer, Airline Pilot, Director, Product Manager, and Senior Manager all appeared in meaningful numbers. That range is editorially useful because it pushes against the habit of treating E-3 as a narrow engineering category.
For employers, the implication is straightforward: wage, seniority, and SOC classification need to line up before the filing reaches the LCA stage. A high title with thin duties is risky. A lower title with senior responsibilities can be just as awkward. The filing should read like a coherent employment story, not a retrofitted form.
Top SOC occupations (2026-Q2)
Annualized wage percentiles (2026-Q2)
Median wage trend by quarter
Geography and employers
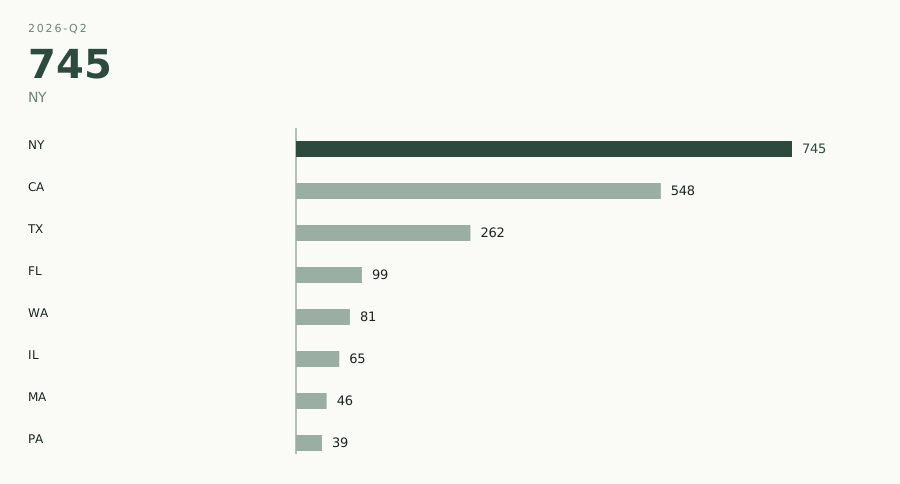
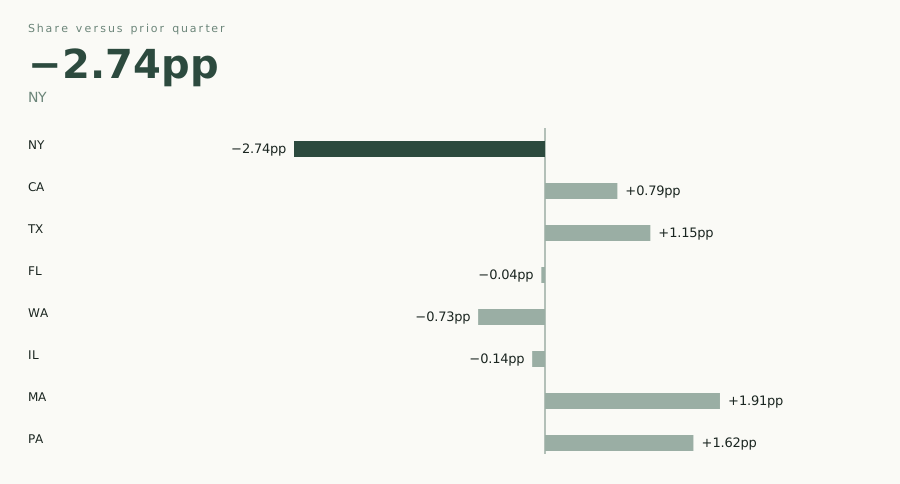
Geography remains a strategic constraint. New York, California, and Texas accounted for 64.63% of filings, with New York alone at 745 filings. New York’s share fell 2.74 percentage points from the prior quarter, while California and Texas picked up share. The top-state chart shows the same basic pattern: the E-3 filing map is still dominated by a small set of high-skill labor markets.
That concentration is not surprising, but it is still useful. Most activity clusters where finance, technology, and specialist services already compete for senior talent. Employers outside those hubs should expect their filing pattern to be less represented in the public data, which can mean more work in the narrative portion of the case. If your worksite is in a less common market, the filing should do more explanatory work on role scope, team structure, and why the position is genuinely specialty in nature.
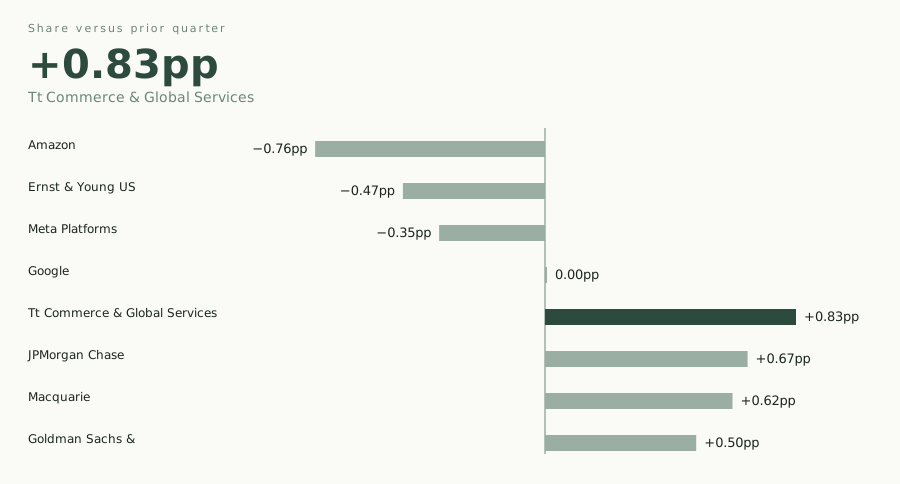
The employer list is familiar but not static. Amazon led the quarter with 41 filings, followed by Ernst & Young US with 34, Meta Platforms with 24, Google with 21, Tt Commerce & Global Services with 20, JPMorgan Chase with 16, Macquarie with 15, and Goldman Sachs & with 12. Amazon, Ernst & Young US, and Meta all remained visible repeat filers, but the share-shift chart shows movement underneath the top line. That is normal in a quarterly public dataset; it is also why employers should avoid overreading any single quarter as a strategic pivot.
The practical takeaway is that repeat filers and first-time or occasional filers are operating in the same public market, but not with the same margin for error. Repeat filers can absorb process slippage more easily. Everyone else should treat the LCA as a controlled document, not a clerical step.
Top worksite states (2026-Q2)
Top state share shift vs prior quarter
Top employer share shift vs prior quarter
What this means for employers
The quarter’s message is not that E-3 sponsorship got harder or easier in any dramatic sense. It is that the category continues to reward preparation. The filing count bounced back, the certification rate stayed near 93%, and the wage distribution remained high and wide. That combination points to a market where the real work is in role definition, wage support, and timing.
For HR leaders, founders, in-house counsel, and mobility teams, the planning lesson is practical:
- Build the role first, then the filing. The SOC, duties, and wage need to tell the same story.
- Treat geography as part of the case file. A less common worksite may need more context, not less.
- Do not confuse a certified LCA with a visa outcome. It is a necessary step, not the finish line.
Australian professionals should read the quarter the same way. The E-3 remains a viable pathway, but the public data suggests it is best approached as a structured sponsorship process, not a last-minute mobility fix. The employers that do this well are usually the ones that start early, document carefully, and keep the filing aligned with the actual job.
Possible explanations worth watching from public source context:
- Median offered wages changed down by 2.6% QoQ, directionally consistent with broader wage-cost movement reported in national labor-market releases. (bls-eci)
- Demand for sponsored roles can shift with overall hiring conditions and open-position volume, potentially influencing which occupations and employers appear in the quarterly filing mix. (bls-jolts)
Methodology & limitations
- LCA filings are not visa issuances, and should not be interpreted as visa approvals.
- Withdrawn does not mean denied; withdrawals often reflect business or candidate changes.
- Employer names were deduped using canonicalization rules (for example, Google LLC and Google Inc. are treated as one employer).
- This analysis uses public-disclosure data from DOL LCA records and includes no worker-level PII.
Related reading
- The Labor Condition Application (LCA) for E-3 visas for field-level compliance detail.
- E-3 visa vs H-1B for how the category compares with the other common employer-sponsored option.
- The complete E-3 visa guide for core category fundamentals.