
E-3 visa guide
The Q3 filing drop was a mix shift, not a wage reset
FY2026 Q3 DOL disclosure data: E-3 LCA filings fell 6% as software and management roles cooled, while the median offered wage held near $150,000.
By Kelvin Tran · 7 min read · Published Oct 1, 2026
Reviewed by Kelvin Tran, Admitted in New York and Victoria, Australia
The market read
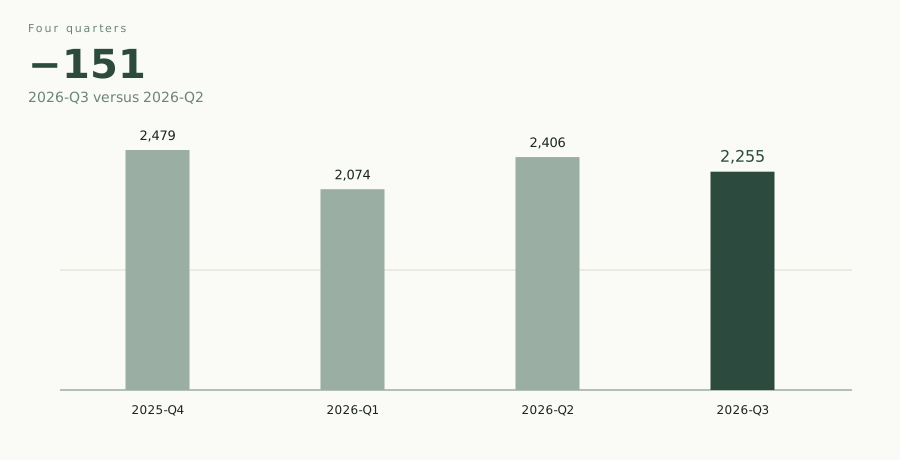
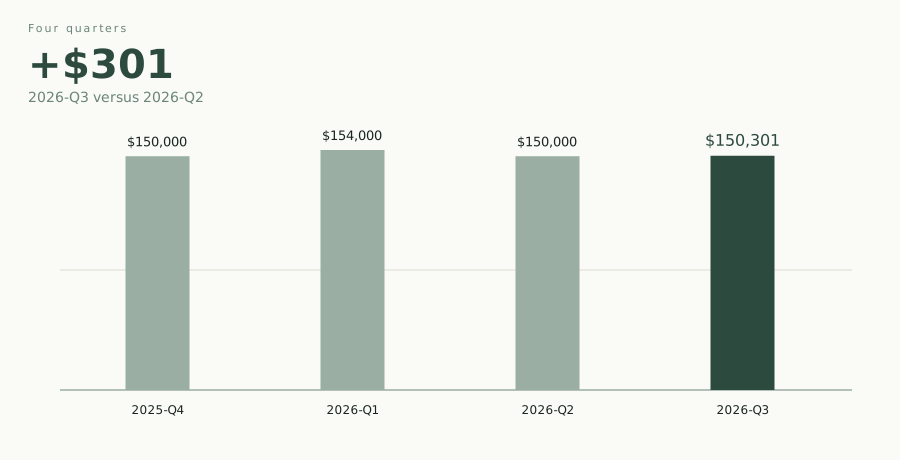
E-3 sponsorship did not get cheaper in 2026-Q3. It got narrower. Employers filed 2,255 labor condition applications, 151 fewer than in 2026-Q2, a 6.28% decline. The median annualized offered wage moved from $150,000 to $150,301. Denial counts stayed at 85, against 84 the quarter before.
The volume drop is an occupation story. Management occupations fell from 682 filings to 598. Computer occupations fell from 514 to 446, and 64 of that 68-filing decline was software developers, from 236 to 172. Architecture and engineering fell from 169 to 127. Legal filings rose from 73 to 97, and healthcare practitioner filings rose from 72 to 93. Management and computer roles together shed 152 filings, more than the net decline, because other occupations were still adding cases.
LCA filings are not visa issuances. A certified labor condition application is an employer attestation about the job and the wage, not a consular decision and not a headcount.
Four-quarter filings trend
Where the quarter actually moved
Across the last four quarters, filings ran 2,479, 2,074, 2,406, then 2,255. Q3 sits above the Q1 trough and below the Q2 rebound. It is 9.04% under 2025-Q4. Software developers followed a sharper version of that path: 226, 203, 236, then 172. Their share of all E-3 filings fell from 9.81% in Q2 to 7.63%.
The wage picture splits by percentile. From Q1 to Q3, the 25th percentile fell from $111,845 to $101,816. Q2 had already been $107,000. The median settled near $150,000 after $154,000 in Q1. The 75th percentile is $210,000, unchanged from Q2. The 90th percentile is $280,000, against $280,322. The mean eased from $170,549 to $169,435. Anyone budgeting off the median will miss the softening at the bottom of the distribution, which lines up with lower-paid occupations rather than a cut to senior offers.
Certified filings did the declining: 2,238 to 2,093. Withdrawals were 60, then 61. Withdrawn does not mean denied. The disclosure file does not say why an employer pulled a case, and a withdrawal is not a finding that the role failed a test.
Median wage trend by quarter
Roles, and the wages attached to them
Computer occupations are 19.8% of Q3 filings. Management is 26.5%. Business and financial operations are 22.3%. Those three groups are most of the file, which is why a software-only reading of the E-3 market keeps misleading people. Arts and media held steady at about 6.7%. Engineering’s share fell from 7.0% to 5.6%.
Inside software, the remaining cases paid more. The software-developer median rose from $173,000 to $184,558 while the count fell by 64. Two of those 172 filings were denied. Employers who did file software roles were not posting bargain wages. They filed fewer of them.
The opposite pattern shows up in market research analysts and marketing specialists: 104 filings, median $88,088, down from $98,500 in Q2, with 9 denials. That is roughly one denial for every twelve filings in the occupation, against about one in twenty-six for the quarter as a whole (85 of 2,255). General and operations managers, still the second-largest occupation at 157 filings, accounted for 6 denials. Lawyers moved from 69 filings to 88, while their median offered wage went from $280,000 to $260,000. Chief executives went from 71 filings to 45, and from a $300,000 median to $285,000.
A title is a weak guide to either the wage or the case. “Software engineer” appeared 40 times at a $200,696 median. “Associate” appeared 34 times at $225,000, down from a $300,000 median on 27 Q2 filings. “Chief executive officer” appeared 34 times at $239,200. “Paramedic” appeared 10 times at $63,024. The 90th percentile of $280,000 and the 25th percentile of $101,816 are different hiring markets sitting in one disclosure file.
Annualized wage percentiles (2026-Q3)
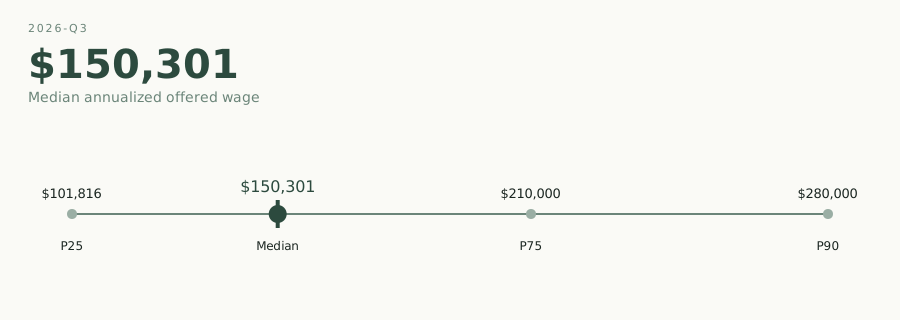
About 11% of filings stated the wage as hourly (255 of 2,255) rather than annual. Those rows are annualized in the percentiles above, at 2,080 hours. A required-wage check still has to use the unit, the worksite, and the occupation on that filing. The quarterly median is not that check.
Geography and who filed
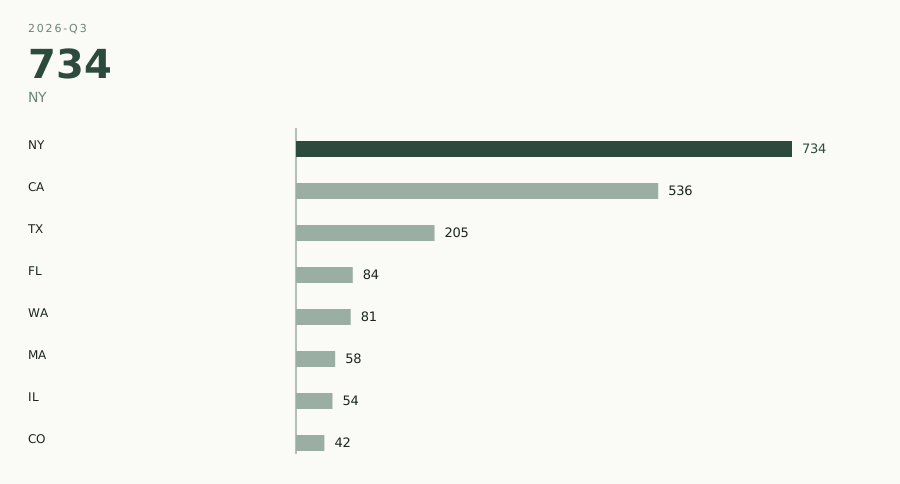
New York, California, and Texas were 65.41% of filings: 734, 536, and 205. New York City alone was 628, which is 28% of every E-3 filing in the quarter and 86% of the New York state total. San Francisco was 153, Los Angeles and Austin 55 each, Brooklyn 53, Houston 43, Seattle 42.
State totals hide the wage mix. California’s median rose from $165,797 to $172,453 while its filing count slipped from 548 to 536. Texas’s median fell from $150,000 to $144,240 as filings fell from 262 to 205. New York’s median was $160,000, up from $158,575, on 11 fewer filings. Washington held at 81 filings, but the state median fell from $180,710 to $166,500. A higher share of a smaller national total, which is what New York and California posted, is not evidence that those markets added sponsorship.
Top worksite states (2026-Q3)
The employer list turned over more than the long tail did. Q3 has 1,503 employer names after deduplication, down from 1,577. Of those, 1,116 filed a single application, 74% of employers and about half of all filings. That one-off share was already about half in Q2. The market did not suddenly concentrate into a few sponsors.
What changed is which names sit at the top. Ernst & Young US went from 34 filings to 6. Tt Commerce & Global Services went from 20 to 2. Goldman Sachs went from 12 to 8. Tesla went from 12 to 18, Anthropic from 5 to 13, and Simpson Thacher & Bartlett from 7 to 12. Heidi Health filed 11 times after not appearing in the Q2 extract. Amazon remained first, 41 then 43, every one of them certified in both quarters. Employer names were deduped before these counts, so Amazon includes the usual legal-entity variants and EY is the US firm we group under that name, not every “Young” in the file.
Eight employers on the published top list still account for under 7% of filings. A company comparing itself with Amazon’s 43 applications is comparing itself with 1.9% of the quarter.
What this means for employers
If the role is software, management, or engineering, this quarter is a reason to look at whether the position is still being filed in the same volume, not a reason to mark wages down. Software-developer offers in the file moved up, not down. If the role sits near the bottom of the wage distribution, especially market research and similar specialist-but-lower-paid classifications, the denial count is less abstract: that occupation contributed 9 of 85 denials.
Legal and healthcare filings rose while the headline total fell. That is a poor moment to describe the E-3 as a tech visa that had a quiet quarter. It is also a poor moment to treat a familiar title as enough. A specialty occupation case is still built from duties, the degree, and the wage for that worksite. Compensation in this file is a benchmark, not the prevailing-wage determination.
For a single Australian hire, the practical comparison is the occupation and the city, not the national median. A New York City role and a Houston role are not interchangeable in this data, and a one-filing employer is the typical employer. Half the quarter looks like that.
Methodology & limitations
- LCA filings are not visa issuances, and should not be interpreted as visa approvals.
- Withdrawn does not mean denied; withdrawals often reflect business or candidate changes.
- Employer names were deduped using canonicalization rules (for example, Google LLC and Google Inc. are treated as one employer).
- This analysis uses public-disclosure data from DOL LCA records and includes no worker-level PII.
The quarter is filings with a receipt date from 1 April 2026 through 30 June 2026 in the FY2026 Q3 disclosure file. Prior-quarter comparisons use the same method on the FY2026 Q2 and Q1 extracts and the 2025-Q4 window already in those runs. Same-quarter-last-year figures are not in those extracts. Hourly wages are annualized at 2,080 hours before the percentiles are calculated. Counts below are filings, not people.